The Index Matrix app is a powerful tool for 401(k) presentations, either one-on-one or with groups of participants.
Many of the investing principle you’ll want convey include:
- Investing is long-term and requires patience, but outcomes are fairly predictable. Speculation is short-term, unpredictable, and destructive to portfolios over time.
- Understanding basic market history should produce confidence that your goals are met without jumping in and out of stocks or over- or under-weighting different investments based on short-term speculation or emotions.
- Down markets tend to be relatively short, followed by longer periods of rising stock prices.
- Market timing is a futile and very destructive behavior.
- Asset class diversification can smooth out the investing experience by reducing portfolio volatility while also increasing expected return.
- Regular, disciplined contributions—regardless of current market levels—will enhance the growth of wealth over time (important for 401(k) investors especially).
Let’s use the app to look at the period 2000 to 2020 (updates through 2021 will be published soon). Here’s what the US Total Market index looks like without returns in the cells:
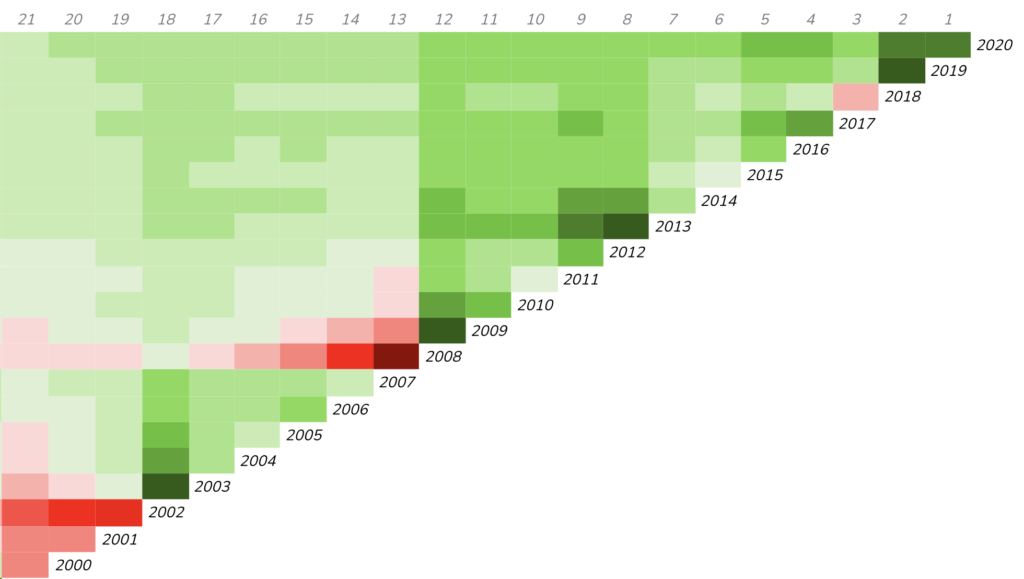
Participants can see at a glance that contributions made every year since 2000 (even during the three down market years of 2000, 2001, and 2002) show positive annual returns (top row). You should point out, of course, that this illustration assumes market performance with contributions made on the first day of the year–it’s shown for general educational purposes only. Contributions to real portfolios with bi-weekly contributions will differ somewhat from this illustration.
You can then “show returns” in the cells to illustrate the changes in annual returns based on the starting point:
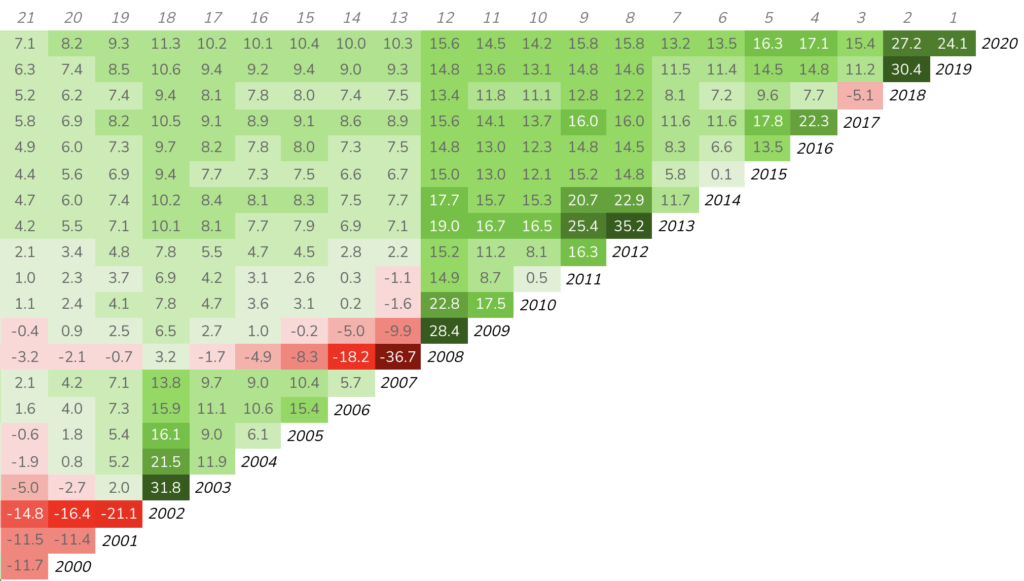
Contributing during down markets of 2000, 2001, and 2002 resulted in returns less than the historical average for the market (7.1%, 8.2%, and 9.3%, respectively) through 2020, but returns for contributions after those down years resulted in equal or much higher-than-average returns. Even contributions made in the extreme down market of 2008 (-36.7%) have compounded at the historical average through 2020 (10.3%) because of the subsequent up years.
This is also good time to explain that the high annual returns (top row) since 2008 are likely to “regress to the mean” over time. Setting reasonable expectations is always good policy.