
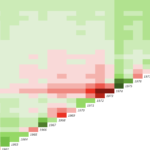
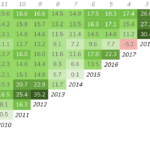
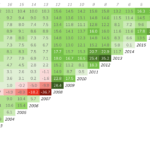
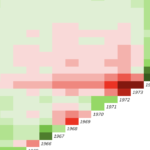
I’ve been asked on numerous occasions why I don’t publish a matrix with an asset class mix. The answer is that a mix of, say, 30% Dimensional US Market Index, 30% Dimensional US Large Cap Value Index, and 40% Dimensional US Small Cap Value Index (keeping the return series as long as possible by eliminating foreign stocks) would produce a heat-mapped matrix that is visually indistinguishable from the 100% Dimensional US Market matrix.
The annual compounded return for the mix from 1928 to 2020 produced a return of 11.8% versus 10.0% for the US market, but you won’t see this on the heat-mapped matrix. This is due to the return ranges I use for each color.
This is why I continually emphasize the importance of using these investing images as powerful high-level educational tools. Your next logical step, after helping your client be more informed of the long-term potential of the market in general and asset class diversification more specifically (using the US small value stock matrix as a comparison), is to work them through asset class mix scenarios (the “weeds”) and decide on the one right for their circumstances. Then the annual compounded return becomes more important, particularly as you discuss the reduced portfolio risk of the strategy.


One Response
Good answer; I originally thought that myself but but positioning the US Market and US Small Value posters side-by-side you can see the ADDITIVE effects of adding small/value, with the overall mix landing somewhere in between.
There is also the poster/visual you used to produce showing the US Market and Asset Class Mix breakdowns side-by-side with long-term returns reported. That would be a good one to bring back