Investors are rightly concerned about inflation today.
The Index Matrix can help alleviate some concern for those who have a well-diversified asset class portfolio.
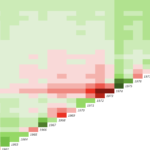
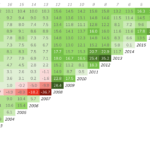
Start by pulling up the Total US Market Research index and click on “After” Inflation.

You will immediately notice the huge effect of high inflation in the 1970s.

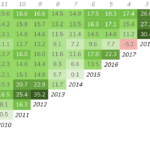
Now pull up the US Small Value Research index, click the “After” button under Inflation and notice the difference in the colors for the same period.

If you have a large screen or two monitors, you can open two windows with the Index Matrix app, one with the Total Market index and the other with US Small Value.
Remember that the Index Matrix app is a powerful visual tool. So, let the shades of red and green tell your story. Or, if you like, turn on the returns in the cells (“Show Returns?” button) to zoom into the numbers.


